GUEST BLOG: The demand-side of worldwide military markets
BlogApril 24, 2025

Ray Alderman
VITA Standards Organization

WARFARE EVOLUTION BLOG: The time has arrived for us to pull together the previous eight articles about the worldwide military platform markets, and organize that data in a clear and informative manner. We could spreadsheet all these numbers and produce some scatter plots or bubble charts. But, they seem so cold and dull. So, let’s take a more aesthetic and artistic approach, the "feng shei statistical analysis method” using balance and harmony. That requires a modified tree diagram. Everybody loves a good tree diagram.
The foundation of a modified tree diagram is the roots, the big-picture information, so that’s where we will start and work our way up. There are 195 countries in the world, so the first root is the list of defense budgets by country. The Global Firepower website keeps those numbers updated well. The second root is the list of countries by their military spending-to-GDP ratio (that’s on wikipedia). The third root is the SIPRI report (Stockholm International Peace Research Institute). That report lists which countries are building military platforms, which countries are buying military platforms, and which countries are importing or exporting military platforms. The worldwide military market in 2023 was $2.443 trillion and grew 6.8% over 2022 (the 2024 numbers will be released by SIPRI in a month or so).
The fourth root is to look at which platforms countries are presently deploying and operating. They will likely buy more of those platforms. I have put that data together for you. 112 countries buy and operate tanks made by 57 suppliers. Reportedly 145 countries buy and operate ground combat vehicles made by 90 suppliers. 94 countries fly fighter planes made by 10 or 12 suppliers. Only three countries (U.S., China, and Russia) fly long range bombers made by three or four suppliers. Reportedly 153 countries fly military helicopters made by five or six suppliers. One hundred countries fly UAVs (unmanned aerial vehicles) made by 20 or 30 suppliers. Fifteen countries fly military satellites made by four or five suppliers.115 countries operate naval warships made by 10 or 12 suppliers. Submarines are operated by 43 countries and the vessels are made by five or six suppliers. And, 40 countries operate unmanned naval vessels made by four or five suppliers. You can get all this information from the Global Firepower website with a little work.
The fifth root is the detailed military budgets of the different countries, that show which platforms they have budgeted to buy. Some countries have their military budget details on the web. While this might look overwhelming, just relax. After you study the reports mentioned above, you’ll immediately see that there are only 25 countries you need to track. They constitute the bulk of worldwide military platform spending. Here they are: In North America, it’s the US and Canada. In Europe, it’s the UK, Germany, France, Italy, Netherlands, and Spain. In the Nordic countries, it’s Denmark, Finland, Sweden, and Norway. In the Baltic states, it’s Poland, Lithuania, Estonia, and Latvia. In the Pacific, it’s Japan, Australia, South Korea, Taiwan, and India. In South America, it’s Brazil. In the Middle East, it’s Saudi Arabia, Israel, and UAE. The rest don’t buy many military platforms. You can see that clearly when you study the Global Firepower website. We are ignoring Russia, China, North Korea, and Iran in this essay for obvious reasons.
To read more Warfare Evolution Blogs by Ray Alderman, click here.
Now that we have the foundation established, we can start building the tree. Since the longest branches are the lowest on the tree, we will organize the platform market research reports by the volume of those platforms forecast to be shipped (instead of using dollars or growth rates). The first long branch is UAVs (unmanned aerial vehicles). The Fortune Business Insights market report says that the UAV market was $12.56 billion in 2022, growing to $35.6 billion by 2030, a CAGR (Compound Annual Growth Rate) of 14.1%. Millions of UAVs are being bought: MALE (10-20), HALE (hundreds), LASE (millions), Micro (thousands), and Nano (hundreds). You need to read my previous article to know what they are.
The next long branch is GCVs (ground combat vehicles). According to MarketsandMarkets (a research company), the market for armored ground vehicles was $51.6 billion in 2024, growing to $60.7 billion by 2029 (a CAGR of 3.3%). About 50% of this growth will be in Europe. We’re talking about hundreds of thousands of these vehicles being built.
The third branch is tanks. According to Spherical Insights (a research company), the global market for tanks was $6.8 billion in 2023, growing to $7.3 billion in 2033 (a CAGR of 0.7%). Most countries that have tanks are upgrading them, not replacing what they have. The market for new tanks is primarily in the Asia-Pacific region. But, we’re still talking about hundreds of new tanks being built.
The next branch up the tree is fighter planes. According to Mordor Intelligence, the worldwide market for fighter planes was $45.6 billion in 2023, growing to $54.8 billion by 2028 (a 3.7% CAGR). More than 500 fighter planes are on order with different manufacturers.
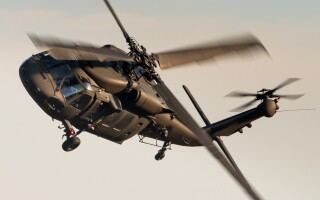
The fifth branch is helicopters. According to Mordor Intelligence, the worldwide market for military helicopters was $8.6 billion in 2024, growing to $10.21 billion in 2030 (a CAGR of 2.9%). That’s a few hundred units.
The next branch is naval warships. According to GlobalData, the worldwide market for naval vessels and surface combatants was $44.2 billion in 2023, growing to $65.8 billion by 2033 (a CAGR of 4.1%). That’s maybe 50-60 ships, including the small ones for coastal defense. There’s a small branch growing off of this bigger branch. According to Markets.US (a research company), the worldwide market for smaller naval patrol boats will grow from $21.2 billion in 2023 to $40.5 billion by 2033 (a CAGR of 6.7%). This says that not many big ships (carriers, destroyers) will be built, but smaller warships will be the bulk of the volume.
Now, we’re getting up to the smaller branches at the top of the tree. The 7th branch is UUVs (unmanned underwater vehicles). According to Fortune Business Insights, the worldwide market for UUVs was $3.02 billion in 2022, growing to $8.14 billion in 2030 (a CAGR of 13.5%). That might include some underwater salvage drones along with mine hunters, submarine detectors (distributed sonar), oceanographic research vessels, and signal intelligence (SIGINT) UUVs. That might be 100 platforms or more.
The 8th branch is USVs (unmanned surface vessels) for the navies. According to MarketsandMarkets, the worldwide market for USVs was $0.8 billion in 2023, growing to $1.2 billion by 2028 (a CAGR of 10.3%). You’ll need to read my previous article to see what’s being built, but we’re talking about 20-30 of these platforms. The first unmanned missile boat for the U.S. Navy (USX-1) was launched this month. It’s 180 feet long, displaces 265 tons of water, and looks like it has vertical-launch missile tubes fore and aft. And, it operates without any humans onboard.
The next small branch is military satellites. According to Mordor Intelligence, the worldwide market for military satellites was $31.97 billion in 2024, growing to $53.85 billion in 2029 (a CAGR of 10.99%). That’s probably 30-40 military birds being built over the next few years.
The 10th and final branch is strategic long range bomber aircraft. According to Business Research Insights, the bomber market was $6.8 billion in 2023, growing to $9.2 billion in 2032 (a CAGR of 3.27%). But, that includes Russia and China I suspect. The U.S. is building just a few of the new B-21 Raider bombers each year. These planes cost over $700 million each, so the volume is very low in this segment.
There are a number of research reports about the military markets on the web. I just picked some for the previous articles and for this one. You can do web searches and read the executive summaries of these reports if you want to dig deeper into this topic and expand your own tree diagram. Based on my experience in reading all these report summaries and websites, taking notes, and writing these nine articles, you are probably looking at over 100 hours of work. What you have here, in this article and the previous eight articles, is simply an outline for the project. Once you get it done, SIPRI, Global Firepower, and all the market research companies will update their reports and websites and you can do it all over again! The 2024 updated market reports are just starting to be released now, and the numbers are moving around, so I am updating my tree diagram.
Additionally, we are seeing political changes and new military platform priorities in the U.S. and in Europe. These political events could move the numbers around in the near future. The European Commission just announced $840 billion to be spent on rearming European Union (EU) countries over the next few years.
Next time, we’ll construct the supply-side tree diagram of the military markets and connect it to the demand-side tree diagram we created here. I will do this using the double-feng-shei statistical analysis method, in such a beautiful and elegant style, that it will bring tears to your eyes when you read my next article. Both trees are constructed with market research reports focused on platforms, the “big iron” perspective that you see above. The entangled branches, between the two trees, are the market research reports on electro-optical sensors (EO), radar, infrared sensors (IR), SIGINT and electronic intelligence (ELINT) systems, communications systems (COMM), and electronic warfare (EW) systems found in many of these platforms. And, I will reveal the MMR (Magic Military Ratio) that I have derived, and show you how to use it. So, prepare yourself for a metaphysical experience.